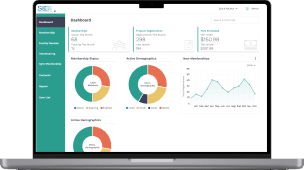
UX/UI Improvements for an Academic Excellence Dashboard​

View GBC
“Idea Theorem has created a visually appealing, user-friendly product that is designed specifically for our unique needs. As we use the system and discover tweaks that are needed, Idea Theorem is fast to reply and adjust the program as needed.
Rebecca Keenan
IBM Director of Human Resources
Service

Customer Research & ​Experience Design

Platforms

iOS, Android

Industry

Finance

The Challenge

The Idea Theorem™ team was assigned the redesign of an internal reporting system for George Brown College education staff. The existing platform lacked user-friendliness and failed to visualize college success rates based on KPIs such as retention and grade distributions. The current reporting system was built on Power BI by Microsoft and had several limitations

Our team was tasked with revamping the usability of the platform while keeping accessibility in mind. We provided design and usability recommendations, and the college education staff created the new platform based on our suggestions. This case study showcases how we improved the appearance of data and created a more intuitive reporting system for the education staff, particularly in Power BI UIUX.​

Our Approach

The first challenge that we encountered in redesigning the internal reporting system for George Brown College education staff was ensuring accessibility needs were being met.​

Thorough Requirements Gathering

Thorough Requirements Gathering

Developed a comprehensive approach to address the Town of Newmarket’s requirements and gather insights from internal and external user groups.

In-Depth Focus Group Sessions

In-Depth Focus Group Sessions

Initiated ten in-depth focus group sessions involving various town departments to foster a comprehensive understanding of internal dynamics and user needs.

Qualitative Feedback and Data Synthesis

Qualitative Feedback and Data Synthesis

Candid discussions in both internal and external focus group sessions provided qualitative feedback, revealing user experiences and expectations. Rigorous data synthesis and analysis produced meaningful insights, utilizing qualitative and quantitative techniques and cutting-edge analytical tools.

Collaborative Alignment with Stakeholders

Collaborative Alignment with Stakeholders

Collaboratively aligned the research plan with strategic goals, utilizing online surveys to capture a wider range of perspectives and ensuring data relevance and reliability through qualification screening criteria.

Slide

The Outcome

Enhanced User-Friendly Platforms

Enhanced User-Friendly Platforms

Successfully redesigned the internal reporting system for George Brown education staff, providing a more accessible and user-friendly academic excellence dashboard that can be navigated by all college staff members.

Improved Accessibility and User Experience

Improved Accessibility and User Experience

Ensured accessibility and user experience improvements across all areas of the platform, making it visually appealing, informative, and easy to navigate.

Concise KPI Overview

Concise KPI Overview

Introduced a concise overview of key performance indicators (KPIs) with detailed reports available for download and sharing, enhancing data accessibility and utilization for staff members.

Focus Mode Feature

Focus Mode Feature

Implemented a focus mode to eliminate unnecessary clutter for casual users, allowing them to view relevant information without distractions, further enhancing user experience and efficiency.

Relevant Case Studies

Transforming a City, One community at a time

Transforming a City, One community at a time

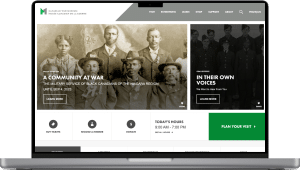
Government Organization makes History more Accessible with UX Audit

Government Organization makes History more Accessible with UX Audit

Green P Parking,
the Toronto Parking Authority

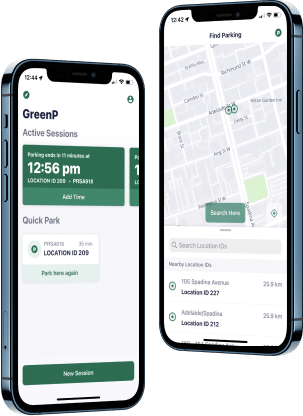
Green P Parking,the Toronto Parking Authority
View All

Let’s have a chat!