Dashboard designs have increased in importance over the years, as enterprises use it to see crucial information at a glance before taking any action. A well designed dashboard shows heavy data in a simple and intuitive way. The information it can present could be from the latest trends, updates to your products or your company. A dashboard is a place where the user can take quick actions or navigate to various areas of application for a detailed view.
At Idea Theorem, we have had the opportunity to work on various enterprise projects consisting of intranets, HR Portal, Cost management tools and SAAS platforms. Along the way we have built several dashboards, here we have put together guidelines to help you design a great dashboard UX.
Armed with the powerful collection of information, a business can make faster decisions based on the information available in a visual and concise manner. A good dashboard design means:
Dashboards can be a daunting task to design, especially, if you don’t have enough information to create a basis for designing the dashboards. Creating a user journey map first will definitely help you understand the journey or touchpoints that the user goes through to complete the task or tasks and the important information that needs to be displayed on the dashboard UI.
A lot of people think that the dashboard is an entire website but in truth, it is one part of the website where the information is summarized and shown to the user. The users can take action there or go to a more detailed page to get more information.
There are several types of dashboards:
1. Know your Audience
Great dashboard UX is created when you know the target audience. Dashboard view for the manager will be different from the team member’s view. It is important to know what kind of data the targeted users will be interested in or what is their level of expertise. Doing some user research will help you understand your users.
2. Choose the right kind for data visualization
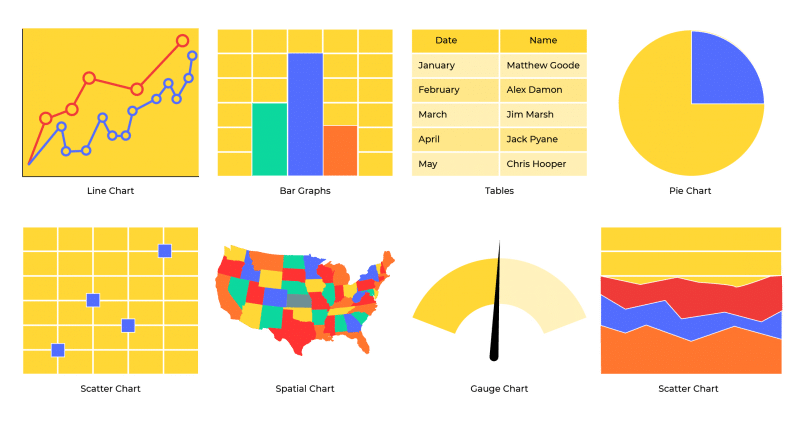
Choosing the right kind of visual to showcase the data is very important for a well designed dashboard. If incorrect visualizations are chosen, then there is a high possibility of missing the concept of a user-friendly dashboard design. It is crucial to learn what type of data needs to be shown to the user in a manner which tells the story of the entire data set.
Knowing your audience will help in determining what data needs to be provided to them. Following are commonly used data visualization types:
Things to keep in mind:
3. Summarise data in 1 screen
Don’t overload users with a lot of information on one page. That is just going to make users confused. Dashboard tends to become cluttered at the end of the day. This will make it harder for the user to focus on any particular table or chart. There would be obviously time and place where different kind of users will be requiring more amount of data, just ensure that relevant data is shown in an organized manner.
Things to keep in mind:
4. Group related information together
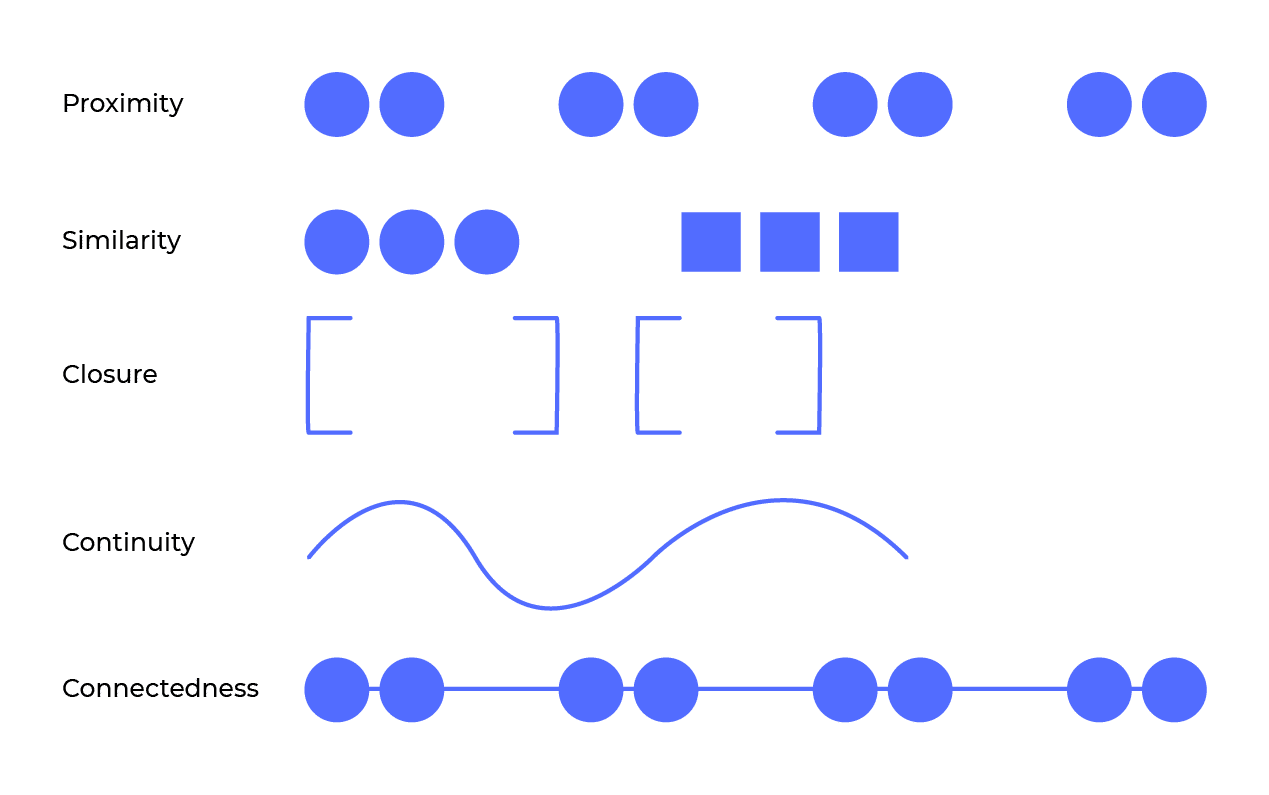
According to the law of proximity, it states that objects that are near, or proximate to each other, tend to be grouped together. This law is useful by grouping together different clusters of content or data for users to view at a glance. This is also called Gestalt Laws of Grouping. These principles are organized into 5 categories: 1. Proximity 2. Similarity 3. Continuity 4. Closure 5. Connectedness.
5. Don’t overdo with colors
It is important to stick to a few colors. Too many colors can overload your audience visually and the users might not be able to focus on their task. Use intense colors to showcase your data to draw the user’s attention, using saturated colors will make users lose interest and might not be able to make the right analytical decision.
Things to keep in mind:
6. Create an intuitive layout
One of the dashboard design best practices is displaying the most significant data on the top part of the dashboard, important information in the middle, and basic or general details at the bottom. This is an intuitive
7. Show the right context
Showing the right context in dashboard design is very important. Context is in the form of text including:
[qodef_blockquote text=”Context is king” title_tag=”h5″ width=”100″]
Without context, dashboard design is meaningless and difficult to understand. Context helps to add emphasis, guide the users to the right information and help them to analyze the data.
Dashboard design best practices stress on consistency and minimalism. First, create personas through user research and then start working on wireframes and then start working on the design. UX plays an important factor and it defines how a dashboard will look and feel.
Idea Theorem is Toronto based UI UX Agency. We create simple and usable products for web and mobile. Our human-centered design approach lets us understand your customers, identify their pain points & deliver solutions that enhance their experience with your brand. Contact Us if you have any questions and we will be happy to help you.