Capabilities
Crafting seamless experiences through research, design, and prototypes. Elevating user interactions.
Building brand identities with UI design and cohesive systems. Shaping memorable user journeys.
Full-stack web, app, desktop, and CMS solutions. Empowering diverse digital ventures.
Navigating cloud strategies, deployments, and DevOps. Unleashing seamless digital transformation.
Ensuring quality through testing and automation. Unveiling meticulous quality assurance.
Unlocking industry potential with Salesforce, SharePoint, PowerBI, Dynamics365. Delve into possibilities.
Industry Platform
Industries
Design secure healthcare experiences and build intelligent platforms that connect UI/UX, development, and AI-driven data for better patient and clinical outcomes.
From idea to launch, craft intuitive products backed by strong development and AI-powered data capabilities to help startups scale faster.
Create accessible digital services by blending thoughtful UI/UX, reliable development, and data-driven intelligence to better serve citizens
Deliver seamless financial experiences through refined UI/UX, secure engineering, and AI-led data insights for banking, fintech, and insurance.
Bring clarity to complex operations with smart interfaces, robust systems, and AI-driven data that support efficiency and real-time decision-making.
Build engaging learning environments with intuitive design, scalable platforms, and data-driven intelligence that supports modern education.
Elevate digital experiences with immersive design, high-performance development, and AI-powered data that drives personalization at scale.
Support meaningful causes with impactful digital experiences powered by thoughtful design, dependable technology, and data-led insights.
AI + Data
Evaluate your organization’s AI readiness with our comprehensive AI Readiness Assessment
Enhance customer engagement with AI-powered chatbot.
Streamlining data for informed decisions through expert analytics.
Streamline operations and boost efficiency with intelligent, AI-driven workflows.
Unlock the power of AI with our Custom AI Solutions.
AI Products
custom conversational AI solutions to support internal & external users
Assisting clients in defining their AI vision, and developing a strategic roadmap.
Evaluating data maturity, identify AI opportunities.
Insights
Dive into the world of design and development. Explore our insights for more.
Unlock valuable assets for your journey. Discover more.
Explore case studies, educational content, and podcasts for deeper insights.
Related Blog
Custom Web Development for FinTech: A Complete 2026 Guide
UX Design Principles That Are Transforming Healthcare Apps in 2026
Cloud Migration for Government: Benefits, Challenges & Best Practices
AI Chatbots in Education: How EdTech Platforms Are Automating Student Support
About Us
Suggested Reads
Trending Resources
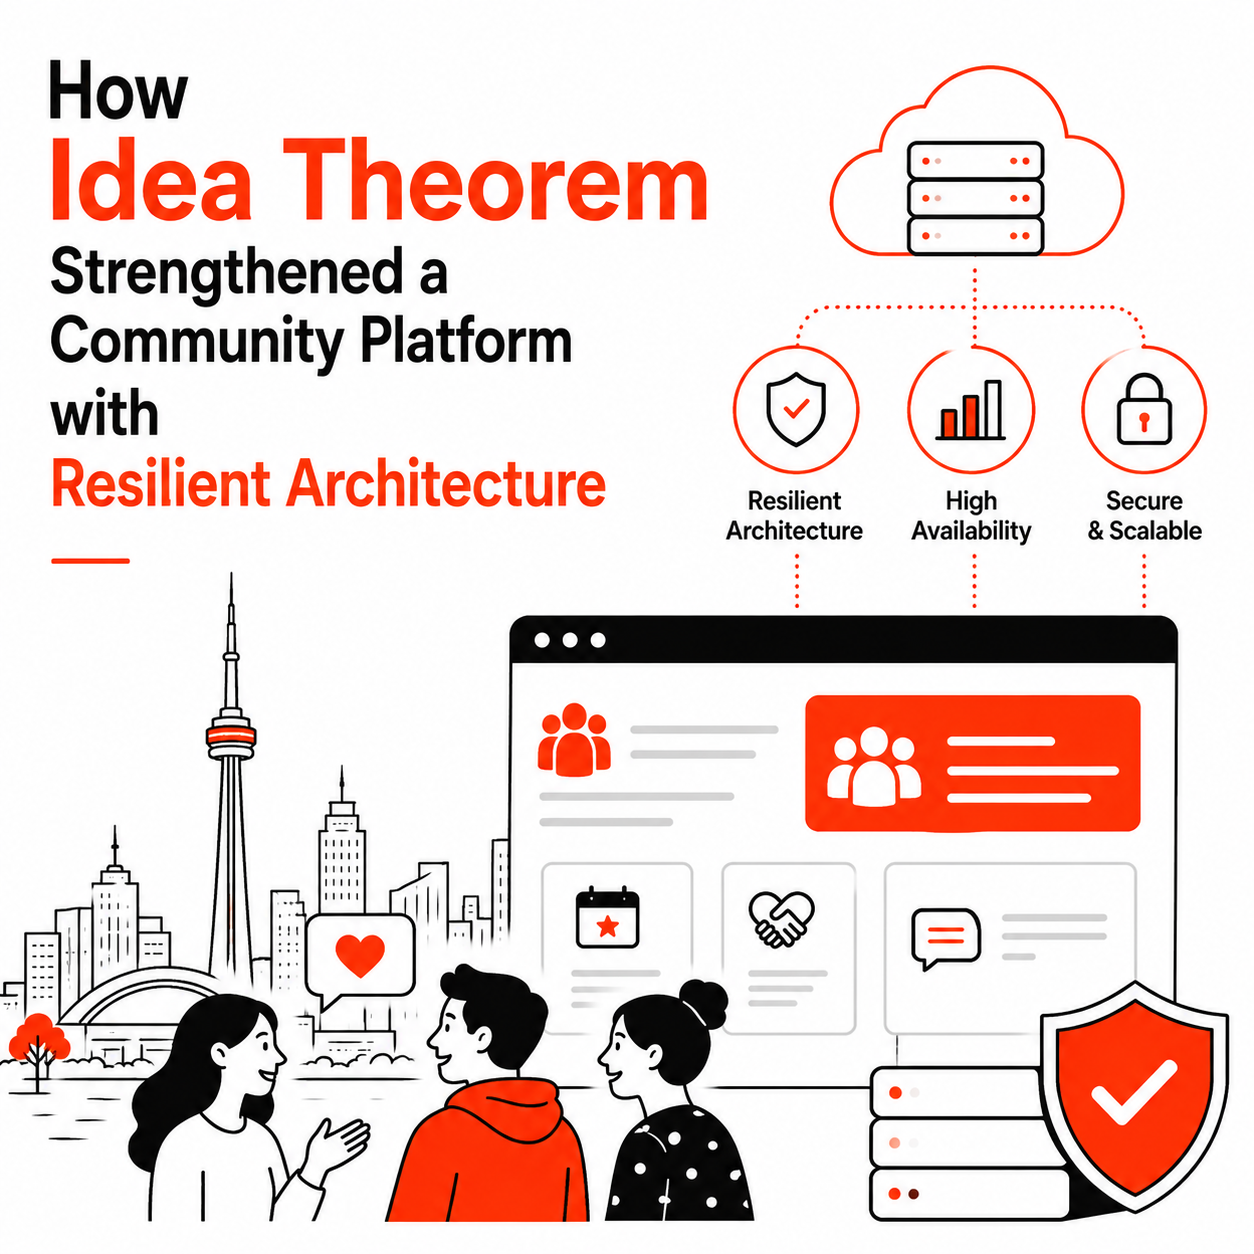
How Idea Theorem Strengthened a Public Sector Community Platform with Resilient Architecture
Things to Keep in Mind While Designing for Web Accessibility
How Product Managers can drive business results through UX Design