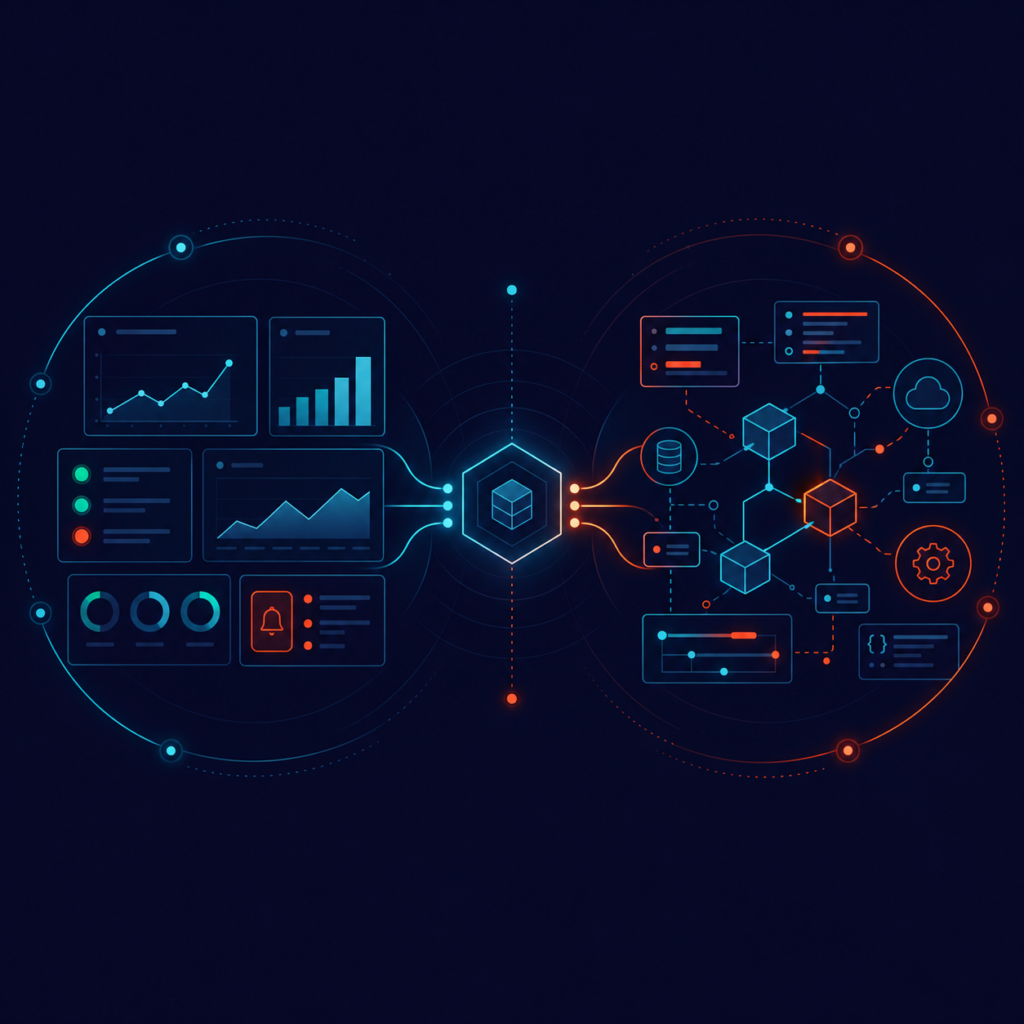
It’s 2 a.m., your dashboard is green, and customers are still complaining that checkout is failing. Every alert you configured stayed silent, because nobody predicted this particular failure. This is the gap at the heart of the observability vs monitoring debate, and it’s becoming a daily reality for teams running distributed, cloud-native software. Understanding how the two differ, and how they work together, is now a core part of keeping digital products reliable.
Monitoring is the practice of collecting and watching a predefined set of signals, such as CPU usage, error rates, and response times, and triggering alerts when they cross a threshold. It answers a simple question: is something wrong right now? Monitoring works extremely well for known failure modes, which is why it remains essential for every production system.
Observability is the ability to understand what’s happening inside a system by examining the data it produces. Instead of checking a fixed list of conditions, teams can ask new questions after the fact and investigate problems nobody anticipated. It answers a deeper question: why is this happening?
| Aspect | Monitoring | Observability |
|---|---|---|
| Core question | Is something wrong? | Why is it wrong? |
| Approach | Reactive, based on known issues | Exploratory, built for unknown issues |
| Data used | Predefined metrics and alerts | Logs, metrics, and traces combined |
| Best suited for | Stable, predictable systems | Distributed, fast-changing systems |
Industry experts generally agree that the two are complementary rather than competing: observability extends what teams can investigate, but it doesn’t remove the need for monitoring.
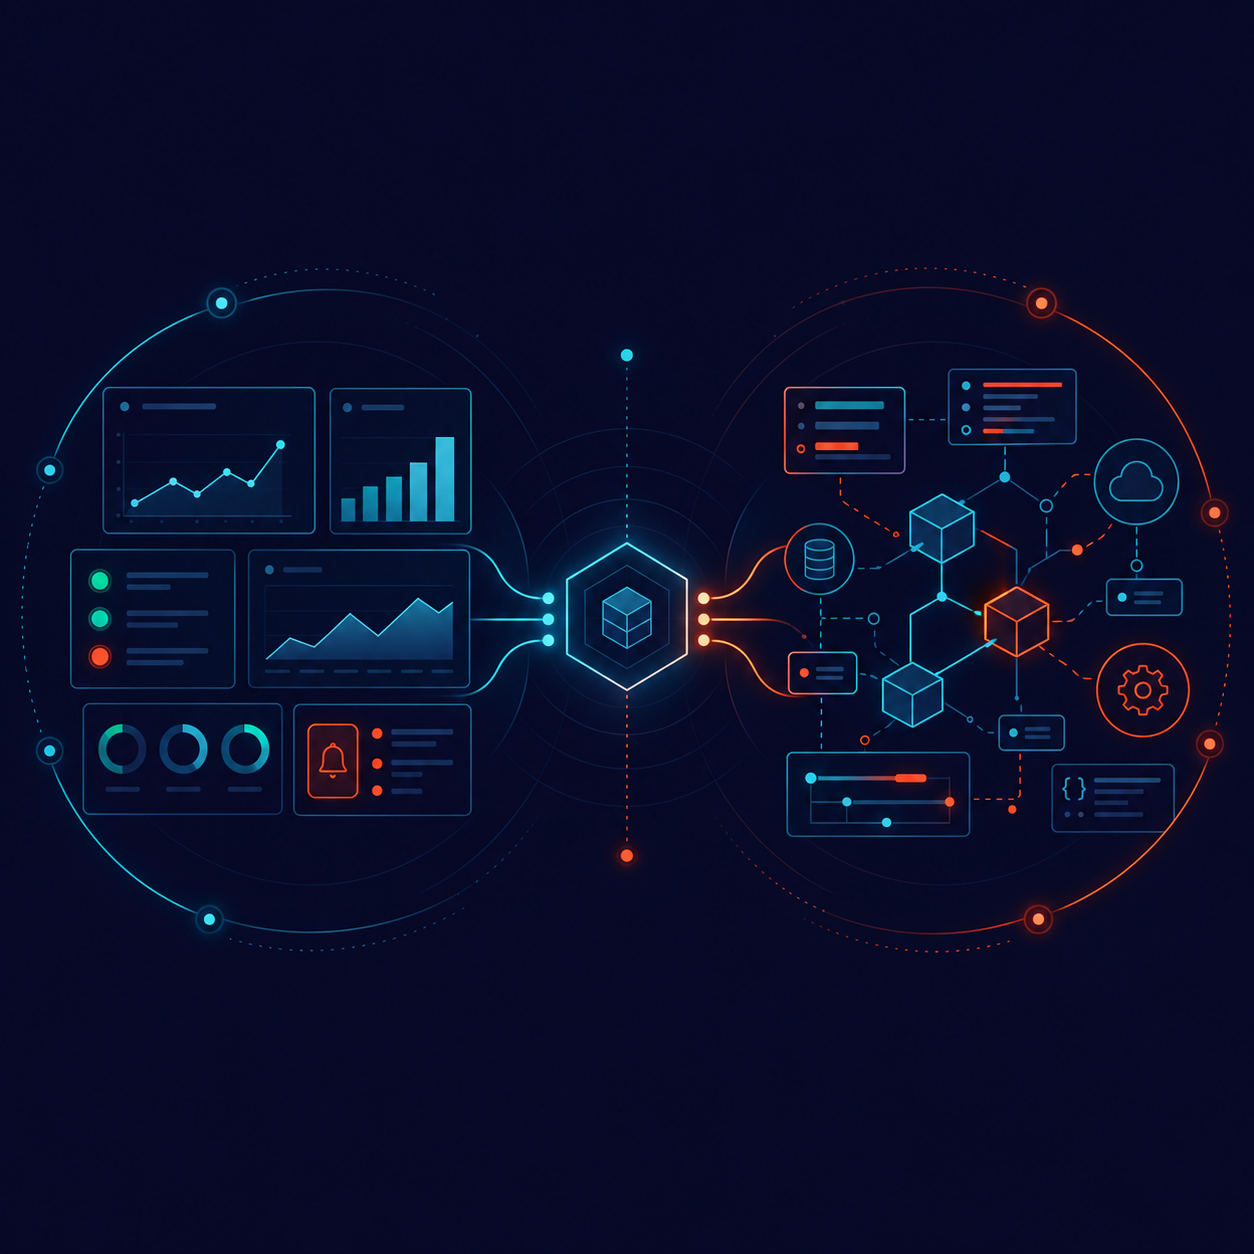
Together, metrics show that a problem exists, logs explain the details, and traces reveal how components interacted. When these three live in separate tools, engineers waste valuable time correlating data by hand, so unified visibility matters as much as the data itself.
In a simple monolithic application, watching a handful of metrics was often enough. Modern systems are different: a single user request may touch dozens of services, each deployed independently. That shift mirrors the architectural trade-offs we explored in our monolithic vs microservices comparison, where greater scalability comes with greater operational complexity. The more distributed your system becomes, the harder it is to predict every way it can fail, and the more valuable observability becomes.
Teams that skip this work often find that poor visibility quietly adds to their technical debt, since every incident takes longer to diagnose and fix.
The observability vs monitoring question isn’t about picking a winner. Monitoring tells you when something breaks, and observability helps you understand why. Businesses running modern, distributed software need both, working from the same trustworthy data.
Suggested Reads
Trending Resources