Turn complex business data into clear, actionable insights with Microsoft Power BI.
Idea Theorem helps organizations use Power BI to connect data, create interactive dashboards, improve reporting, and support faster decision making. Our Power BI specialists design analytics solutions around your business goals, users, data sources, and reporting needs.
Whether you need executive dashboards, operational reporting, data visualization, analytics modernization, or Power BI integration, we help you create a scalable business intelligence environment.
Our goal is simple. We help your teams understand data faster and use it with greater confidence.

A successful Power BI solution starts with a clear analytics strategy.
Idea Theorem provides Power BI consulting services that help organizations understand what data they have, what insights they need, and how Power BI can support better decisions.
We begin by reviewing your existing reports, data sources, metrics, users, and business requirements. Then, we define the right reporting structure, dashboards, data models, integrations, and governance approach.


Give teams a clearer view of performance with interactive Power BI dashboards.
Idea Theorem designs dashboards that turn complex data into simple, useful visual experiences. We focus on the information that matters most to each user.
Executives may need high level performance metrics. Sales teams may need pipeline insights. Operations teams may need real time process data.
Therefore, we design dashboards around real business questions instead of adding unnecessary charts.


Make business reporting easier to understand and easier to use.
Idea Theorem helps organizations replace static reports and spreadsheets with interactive Power BI reporting experiences.
We design reports that allow users to explore information, filter results, identify trends, and compare business performance across different dimensions.
Good visualization also reduces complexity. As a result, teams can spend less time interpreting data and more time acting on it.
We focus on clarity, consistency, and usability across every Power BI report.
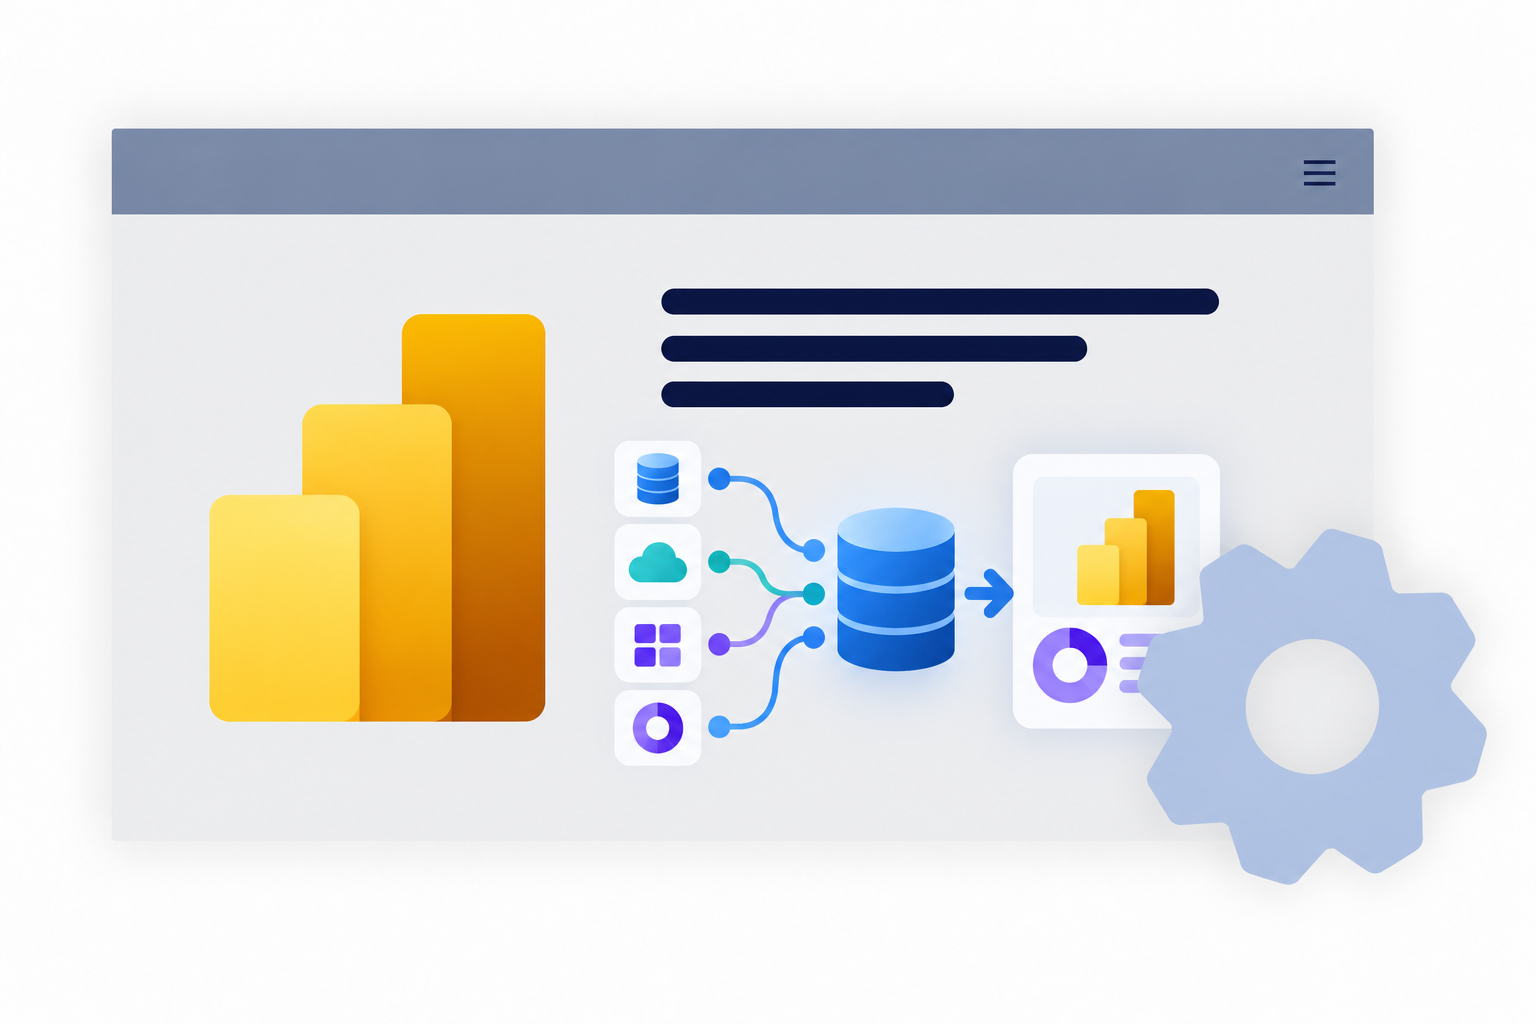
Bring information from multiple systems into a connected analytics environment.
Many organizations store data across CRM platforms, ERP systems, spreadsheets, cloud applications, databases, and other business tools.
Idea Theorem helps connect these sources with Power BI so teams can analyze information from a more unified view.

Strong dashboards depend on a strong data foundation.
Idea Theorem helps organizations structure, transform, and model data before it reaches the reporting layer.
Our team can create semantic models, relationships, calculated measures, business metrics, and reporting logic that support reliable analytics.
We also focus on performance and scalability. Therefore, reports remain useful as data volumes and business requirements grow.
This approach gives teams access to more consistent metrics and helps reduce conflicting versions of the same information.

Create a more connected analytics environment with Power BI and Microsoft Fabric.
Power BI forms an important part of Microsoft Fabric. Together, these technologies can support data integration, analytics, reporting, governance, and AI assisted insights.
Idea Theorem helps organizations understand how Power BI can fit within a broader Microsoft Fabric strategy.
We can support reporting architecture, semantic models, data integration, analytics workflows, and dashboard experiences across the Microsoft ecosystem.
Microsoft now positions Power BI within Fabric as part of a unified analytics experience.
Give teams access to timely dashboards and business insights.
Bring information from different systems into clearer reporting views.
Replace repetitive spreadsheet based reporting with automated dashboards.
Monitor KPIs, trends, targets, and operational metrics.
Turn complex information into visual reports that users can understand more easily.
Give more teams access to trusted business insights.
Ans: A Power BI partner helps organizations plan, implement, integrate, optimize, and support Microsoft Power BI solutions.
Services can include dashboard development, data modeling, reporting, integration, migration, governance, and training.
Ans: Power BI helps organizations connect data, create interactive dashboards, visualize information, and analyze business performance. Microsoft positions it as part of its unified analytics offering.
Ans: Yes. Power BI can connect to many databases, applications, cloud services, Microsoft platforms, files, and enterprise systems.
Ans: Yes. Organizations can use Power BI to analyze Dynamics 365 data and create dashboards for sales, service, finance, operations, and other business functions.
Ans: Yes. Power BI is integrated with Microsoft Fabric and supports analytics, reporting, semantic models, and AI assisted experiences within the Fabric ecosystem.
Ans: Yes. Idea Theorem can support dashboard enhancements, integrations, data models, reporting performance, analytics improvements, and ongoing Power BI optimization.